Caitlin Clark vs. Paige Bueckers: Who’s the Greater Force in Women’s College Basketball?
A Comprehensive Comparison of Bueckers’ and Clark’s Dominance Over the Years
Basketball
Women Sports
College Sports
Author
Aliscyn Hammond
Published
December 10, 2024
In the world of women’s college basketball, few players have captured the attention of fans like Paige Bueckers and Caitlin Clark. Both players have become household names, known for their incredible skills and leadership on the court. From their early years in college to their rise as dominant forces, tracking the growth of Bueckers and Clark offers a fascinating glimpse into their evolution as athletes. I will take a closer look at how these two athletes have developed, comparing their freshman, sophomore, and junior seasons, and analyzing key statistics that highlight their growth. By examining their performance over the years, we’ll explore how they’ve refined their games, faced challenges, and emerged as two of the brightest stars in women’s basketball.
Comparing The Scoring Evolution of Bueckers and Clark
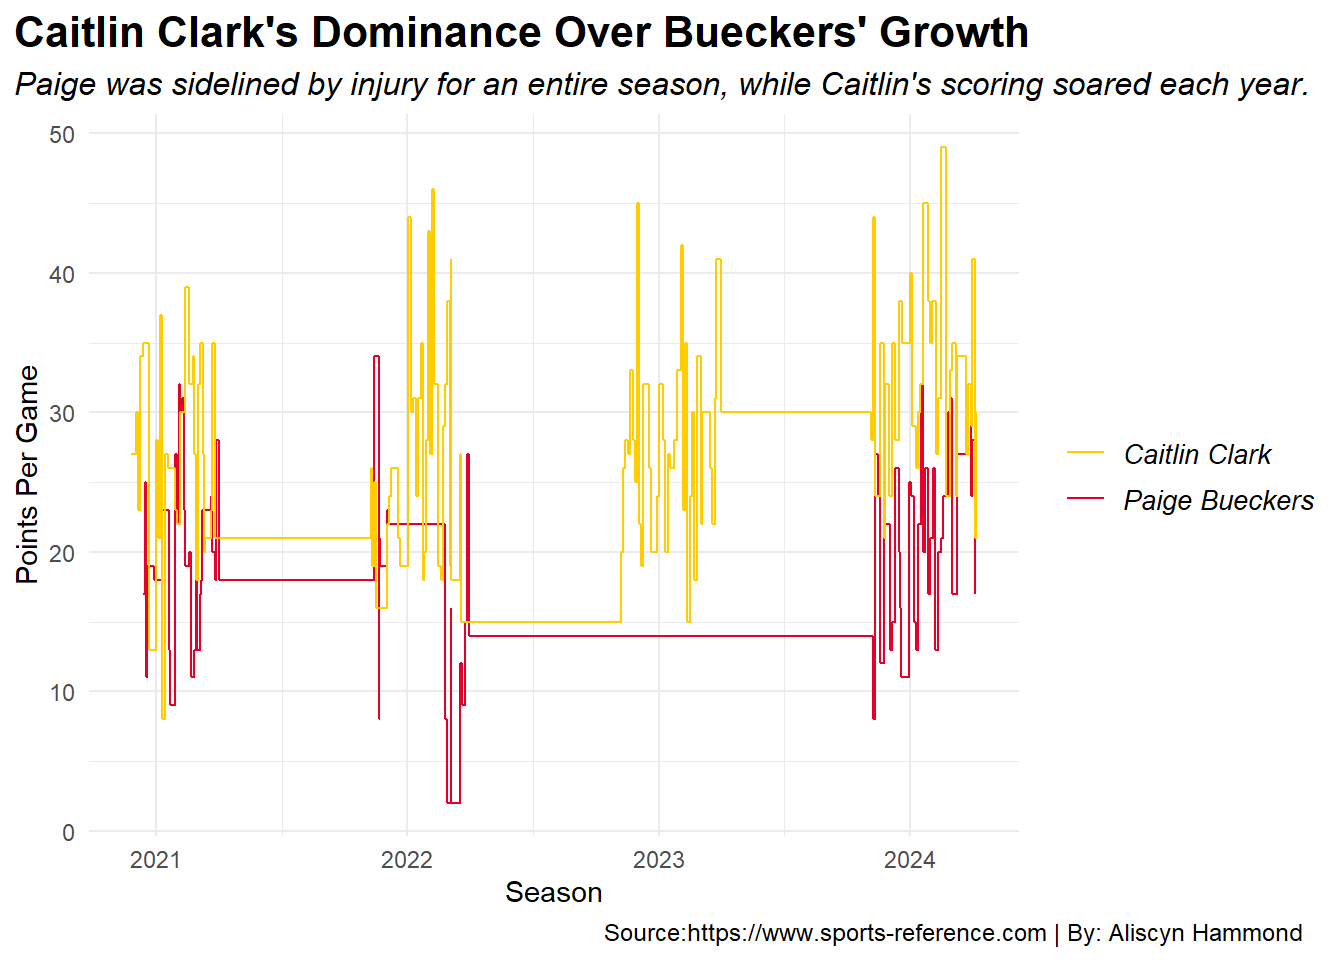
Over the course of their careers in college basketball, Caitlin Clark and Paige Bueckers have seen some remarkable changes in scoring. Both have risen dramatically, with some plateaus, due to a number of factors including injuries and evolving roles on their teams or just off seasons. Plotting the pair’s points per game from 2020 to their recent season in 2024 illustrates these trends, providing a better view of who has taken the most significant leaps in their scoring and when those changes happened.
Code
library(tidyverse)library(ggplot2)library(dplyr)pc<-read.csv("databball/pc_basketball.csv")pb <- pc |>filter(Player=="Paige Bueckers")cc<- pc |>filter(Player=="Caitlin Clark")pb$Date <-as.Date(pb$Date, format ="%Y-%m-%d") cc$Date <-as.Date(cc$Date, format ="%Y-%m-%d")ggplot() +geom_step(data = pb, aes(x = Date, y = PTS, group = Player, color ="Paige Bueckers")) +geom_step(data = cc, aes(x = Date, y = PTS, group = Player, color ="Caitlin Clark")) +labs(x ="Season",y ="Points Per Game",title ="Caitlin Clark's Dominance Over Bueckers' Growth",subtitle ="Paige was sidelined by injury for an entire season, while Caitlin's scoring soared each year.",caption ="Source:https://www.sports-reference.com | By: Aliscyn Hammond " ) +scale_x_date(date_breaks ="1 year", date_labels ="%Y") +scale_color_manual(values =c("Paige Bueckers"="#e4002b","Caitlin Clark"="#FFCD00") ) +theme_minimal() +theme(plot.title =element_text(size =16, face ="bold"),plot.subtitle =element_text(size =12, face ="italic"),axis.title.x =element_text(size =11),axis.title.y =element_text(size =11),plot.title.position ="plot",plot.subtitle.position ="plot",legend.title =element_blank(),legend.text =element_text(size =10,face="italic"),plot.caption =element_text(size =9, hjust =2.3) )
Through the years, one could see the constant uphill climb in Caitlin Clark’s development towards becoming a consistent scorer. Since her early seasons, Clark had shown much skill, and over time those points per game rose quite gradually. By challenging herself every season, she set in concrete her status as one of the most dominant scorer’s in women’s college basketball. Her senior year found her at the height of her scoring ability, continuing to evolve and adapt to the competition while maintaining a high level of performance throughout her career.
Paige Bueckers, on the other hand, faced a unique set of challenges that impacted her scoring trajectory. After starting her career with impressive numbers, she had back to back injuries, for her only to discover that she would be sidelined for her junior season. Which is why for Bueckers, she had no Points Per Game (PPG) during 2023. Remarkably, Bueckers came back for her senior year. After a year-long recovery, she came back into form immediately and put up impressive scoring numbers, nearly meeting Clark’s collective of PPG. The ability to bounce back after such a significant break speaks volumes about her determination and skill, proving that she could still compete at the highest level despite the adversity she faced. She did decide to stay another year at UConn, I am interested to see how her PPG this coming season will compare to Caitlin’s last year in college basketball.
Total Contributions: Key Stat Comparisons Across Seasons
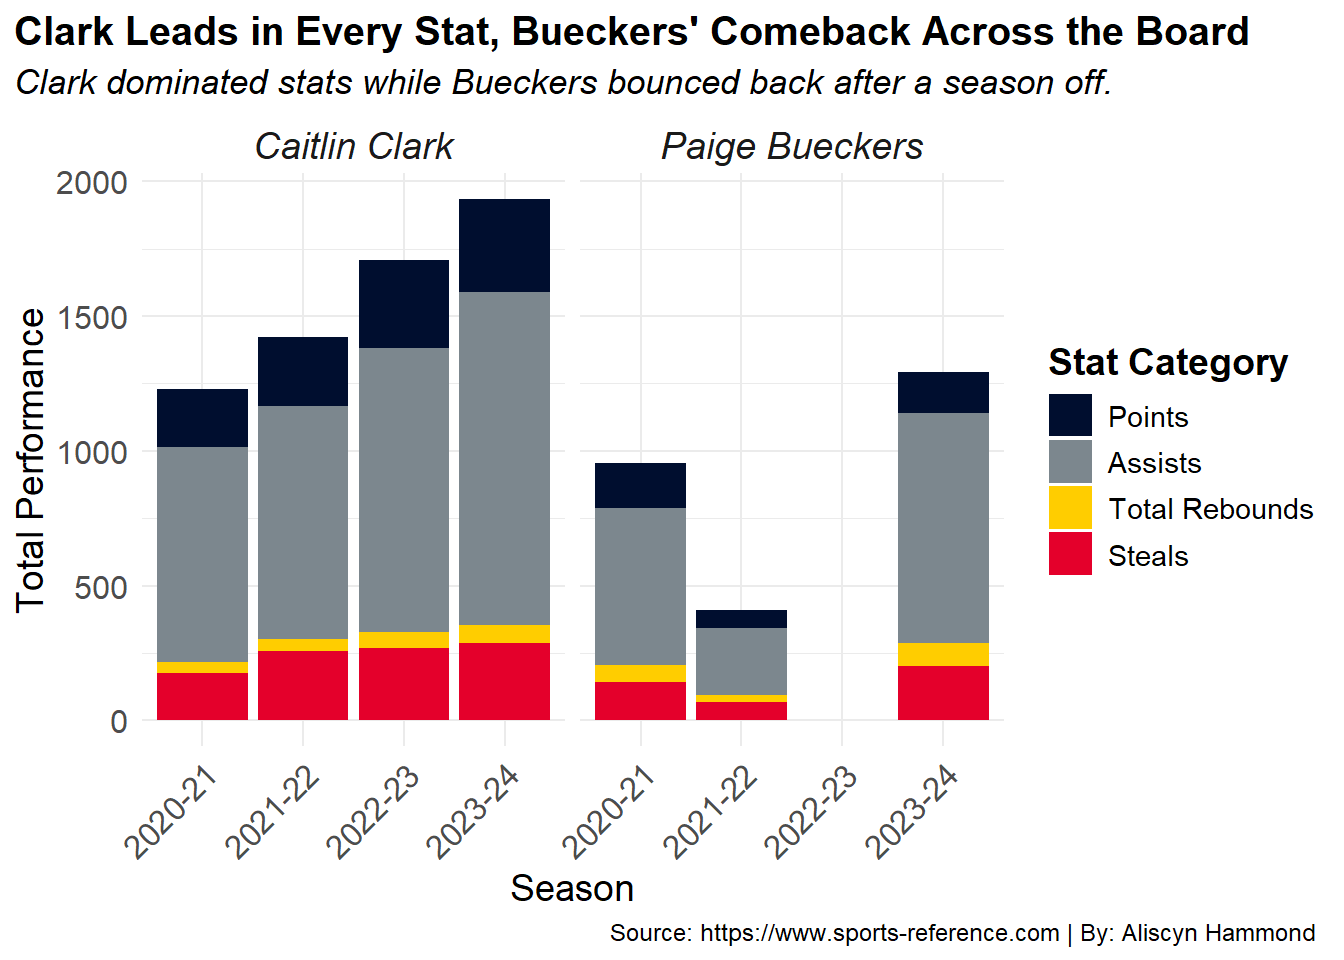
Now, I want to take a closer look at the total contributions of Caitlin Clark and Paige Bueckers across their careers, focusing on key statistical comparisons. By examining their performance over the seasons, we can gain a deeper understanding of how each player impacts the game beyond just scoring. The stacked chart provides a comprehensive view of their contributions in various areas, offering a detailed comparison of their overall influence on the court as they progressed through their collegiate careers.
Code
pc_long <- pc %>%gather(key="Stat",value="Value",PTS,AST,TRB,STL)ggplot(pc_long,aes(x=Season,y=Value,fill=Stat))+geom_bar(stat="identity",position="stack")+facet_wrap(~Player)+labs(title="Clark Leads in Every Stat, Bueckers' Comeback Across the Board",subtitle="Clark dominated stats while Bueckers bounced back after a season off.",caption="Source: https://www.sports-reference.com | By: Aliscyn Hammond",x="Season",y="Total Performance",fill="Stat Category" )+scale_fill_manual(values =c("PTS"="#7C878E","AST"="#000e2f","TRB"="#e4002b","STL"="#FFCD00"),labels =c("Points" ,"Assists","Total Rebounds","Steals")) +theme_minimal()+theme(axis.text.x =element_text(angle=45,hjust=1),plot.title =element_text(size=15,face="bold"),plot.subtitle =element_text(size=13,face="italic"),axis.title.x =element_text(size=14),axis.title.y =element_text(size=14),axis.text =element_text(size=12),plot.title.position ="plot",legend.text =element_text(size=11),legend.title =element_text(size=14,face="bold"),strip.text=element_text(size=14,face="italic"),plot.caption =element_text(size =9, hjust =3) )
After a strong freshman year, Paige Bueckers faced considerable setbacks with back-to-back injuries that impacted her sophomore year and kept her sidelined for the entire 2022-23 season. However Bueckers returned to have a great senior year, posting some of the best numbers. Her assists similarly equaled that of Clark’s sophomore year, while her total rebounds were the highest of all the seasons she played. This is a remarkable return after a year off and underlines not only her resilience but also how she can quickly regain her form and continue at an elite level, matching or bettering her previous performances in key areas.
In all, Caitlin Clark’s totals over the seasons reflect a consistent rise in almost every stat. From freshman year to senior, she made big jumps in almost every stat. Her steals remained consistent from 2021-22 to the 2022-23 season, with slight increase in her senior year, which really shows she can keep up her defensive impact. Clark’s ability to elevate all areas of her game, year after year, solidified her role as a dominant force on the court, where noticeable increases in both scoring and playmaking were present.
Analyzing the Correlation of Key Performance Metrics
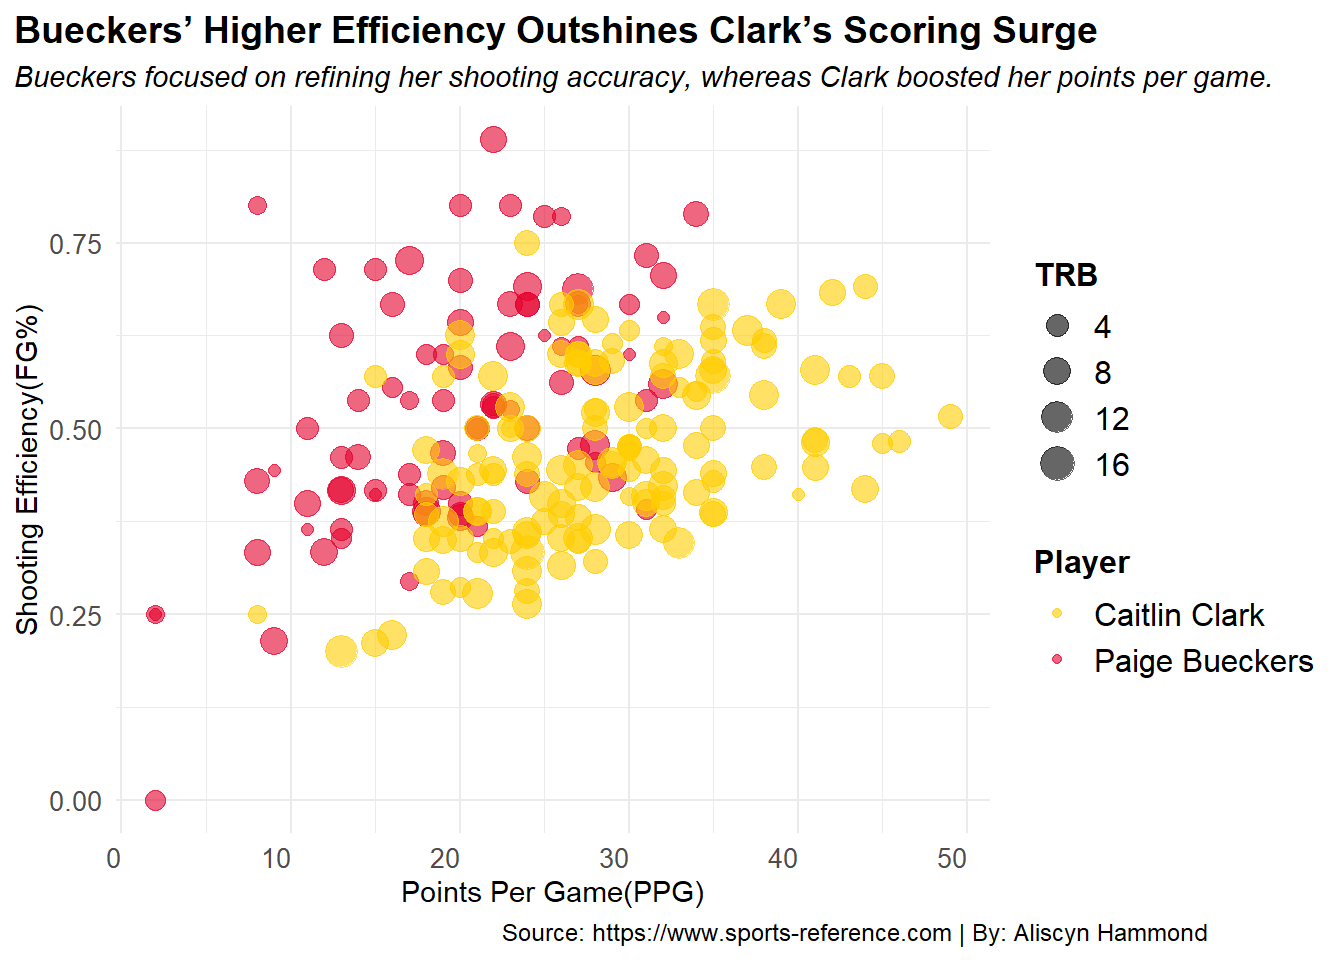
Lastly, I am comparing three key performance metrics: Points Per Game, Shooting Efficiency, and Total Rebounds. Analyzing the relationship between these stats is crucial for understanding how effectively each player is able to generate points while maintaining efficiency. This comparison not only highlights their scoring abilities, but also provides insight into who is able to contribute more consistently across different aspects of the game. With the bubble size representing total rebounds, it offers a visual representation of how each player’s rebounds correlate with their scoring and efficiency.
Code
ggplot(pc,aes(x=PTS,y=FG.,size=TRB,color=Player))+geom_point(alpha=.6)+scale_size_continuous(range=c(2,6))+labs(x="Points Per Game(PPG)",y="Shooting Efficiency(FG%)",title="Bueckers’ Higher Efficiency Outshines Clark’s Scoring Surge",subtitle="Bueckers focused on refining her shooting accuracy, whereas Clark boosted her points per game.",caption="Source: https://www.sports-reference.com | By: Aliscyn Hammond" )+scale_color_manual(values=c("Paige Bueckers"="#e4002b","Caitlin Clark"="#FFCD00"))+theme_minimal() +theme(plot.title =element_text(size =14, face ="bold"),plot.subtitle =element_text(size =11, face ="italic"),axis.title.x =element_text(size =11),axis.title.y =element_text(size =11),plot.title.position ="plot",axis.text.x =element_text(size =10, hjust =1),axis.text.y =element_text(size =10),legend.title =element_text(size =12, face ="bold"),legend.text =element_text(size =12),plot.caption =element_text(size =9, hjust =2.3) )
Caitlin Clark leads in points per game, while having a slightly lower shooting efficiency than Bueckers. Her scoring consistency is evident, as she was able to put impressive numbers year after year, even with a more stable stable shooting efficiency. Clark’s total rebounds also show a larger range compared to Paige’s, which evidences her capability to contribute in multiple areas of the game. While her shooting efficiency remains relatively steady, Caitlin’s scoring prowess and rebounding versatility show her aptitude to impact the game in a broader sense. That balance of scoring and rebounds alone gives her a distinct edge over others in overall contributions.
Paige Bueckers presents an interesting case in this comparison, as she demonstrated significantly higher shooting efficiency than Caitlin Clark. While scoring fewer points per game, her efficiency stands out, especially considering she had a season off and missed games due to injuries. That is really interesting because, even though Bueckers’ setback occurred well into her career, she still maintains a shooting percentage above Clark’s. In terms of that ability to be on the floor and scoring efficiently, she scored much more. This contrast in scoring and efficiency reflects how Paige’s shot selection and execution have allowed her to make the most of her opportunities, even if her overall points per game isn’t as high as Clark’s.
After analyzing all the data and reflecting on the growth of both Caitlin Clark and Paige Bueckers, it’s clear that Caitlin has developed as expected over a full-four year college career and she did even better than the average with showing impressive consistency and improvement in nearly every area. However, what stands out the most to me is Paige Bueckers’ remarkable growth, especially considering the setbacks she faced. Her time off the game in injury could have stalled her career, but she made a strong comeback, one that showed not just the resilience of a girl who had been down, but also how sure she was of her game. If Paige could play her junior year, I really believe she would be mentioned right alongside Caitlin Clark and maybe even compete for an early draft eligibility. Such great shooting this season, which included an over-80% game, speaks volumes about being able to bounce back and still perform at an elite level. I believe that while Caitlin Clark has been tremendous all season and has warranted so much attention in scoring and overall performances, it’s Paige’s journey and her growth that deserve more discussion. But with those major setbacks and a non-full, four year collegiate career, her performance and potential really show just how much of an impact she’s made in such a short amount of time. I am interested to see how she ends up doing this season since she has been in the media’s eyes for awhile and her comeback was already powerful. Just imagine how good she can be after being able to practice without worrying about the progress of her recovery.