Is there a relationship between the number of assists and the final scores of the teams in the 2024 Women’s Elite Eight?
How do winning teams differ in assists compared to losing teams?
Basketball
Women Sports
Elite Eight
Author
Aliscyn Hammond
Published
November 17, 2024
Whether a team’s ultimate score in the Elite Eight is correlated with the amount of assists they record is a subject that coaches, fans, and analysts alike are asking as the 2024 NCAA Women’s Basketball Tournament approaches its end. Assists have a reputation as indicators of good team play and offensive cooperation, but how do they relate to the outcome of games at such a high level of competition? We will explore the relationship between assists and final score, compare winning teams’ assists with losing teams, and find the distribution of assists for winning and losing teams.
The Importance of Assists in Women’s Basketball
In women’s basketball, like any sport, teamwork is an essential part of the sport. A team’s ability to share the ball, provide teammates with opportunities, and maintains offensive flow. If a team has a high assist total, it generally indicates that a team can communicates effectively, which leads to better offensive execution and higher percentage shots. With examining the data, we can evaluate if there is a relationship between a team’s ultimate score and amount of assists they produce and find any trends.
Code
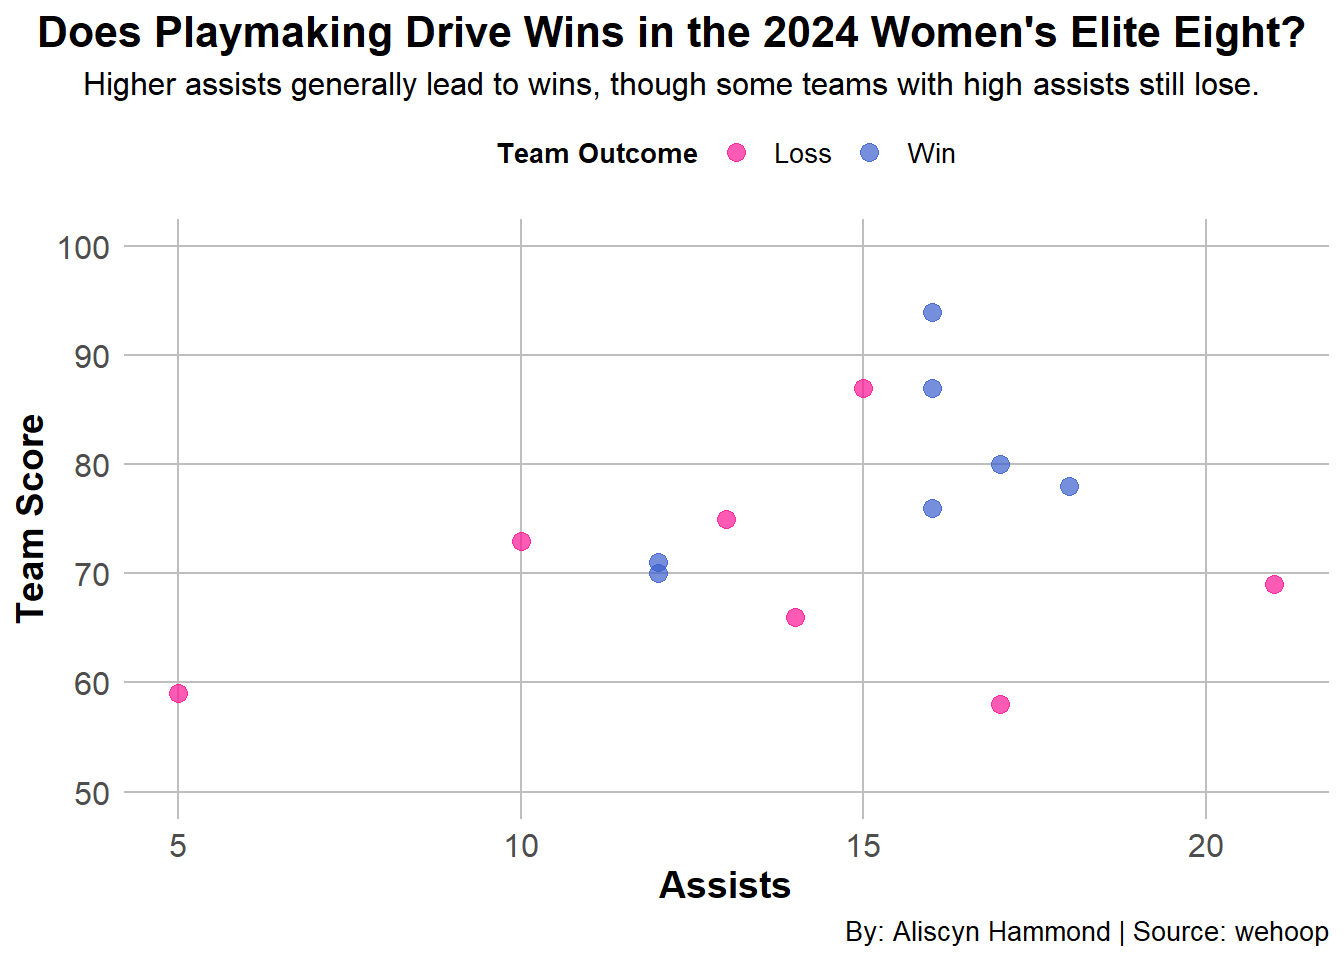
library(tidyverse) library(ggplot2)elite<-read.csv("dataproject/2024_elite_eight_wbb.csv")selected_teams <-c("SC", "ORST", "TEX", "NCSU", "IOWA", "LSU", "CONN", "USC")elite_eight <- elite[elite$team_abbreviation %in% selected_teams, ]ggplot(elite_eight, aes(x = assists, y = team_score, color = team_winner)) +geom_point(alpha =0.7, size =3) +scale_color_manual(values =c("TRUE"="royalblue3", "FALSE"="deeppink"),labels=c("TRUE"="Win","FALSE"="Loss") ) +labs(title ="Does Playmaking Drive Wins in the 2024 Women's Elite Eight?",subtitle ="Higher assists generally lead to wins, though some teams with high assists still lose.",x ="Assists",y ="Team Score",caption ="By: Aliscyn Hammond | Source: wehoop",color ="Team Outcome" ) +theme_minimal() +theme(plot.title =element_text(hjust =0.5, size =16, face ="bold"),plot.subtitle = ggtext::element_markdown(size =12, lineheight =1.2, hjust =0.5),axis.title =element_text(size =14,face="bold"),axis.text =element_text(size =12),plot.caption =element_text(size =10, hjust =1),legend.position ="top", legend.title =element_text(size =10,face="bold"),legend.text =element_text(size =10) ) +theme(panel.grid.major =element_line(color ="gray", size =0.5),panel.grid.minor =element_blank(),plot.title.position ="plot")+scale_y_continuous(limits=c(50,100))+scale_x_continuous(limits =c(min(elite_eight$assists), max(elite_eight$assists)))
The scatterplot visualizes the relationship between the Elite Eight teams’ final scores and the number of assists they recorded in the 2024 NCAA Women’s Basketball Tournament. While there is a general upward trend indicating that teams with more assists tend to score higher, the plot also reveals variability. Notably, some teams recorded high assist numbers, but still lost the game, while others with fewer assists managed to secure a win.
The variability suggests that while assists can be important for offensive success, they are not the sole determinant of the game’s outcome. That is where other outcome’s come into play, such as shooting efficiency, turnovers, or defense. The trend still suggests that strong teamwork and ball movement, as indicated by higher assist totals, often correlate with winning.
How Do Winning Teams Compare to Losing Teams in Assists?
We may then contrast the average number of assists scored by winning and losing teams. This comparison may reveal that teams that win are generally better at creating scoring opportunities for one another, as evidenced by their higher assist totals. A greater number of assists often indicates stronger ball movement and team cohesion, which are key factors for efficient offensive execution.
Code
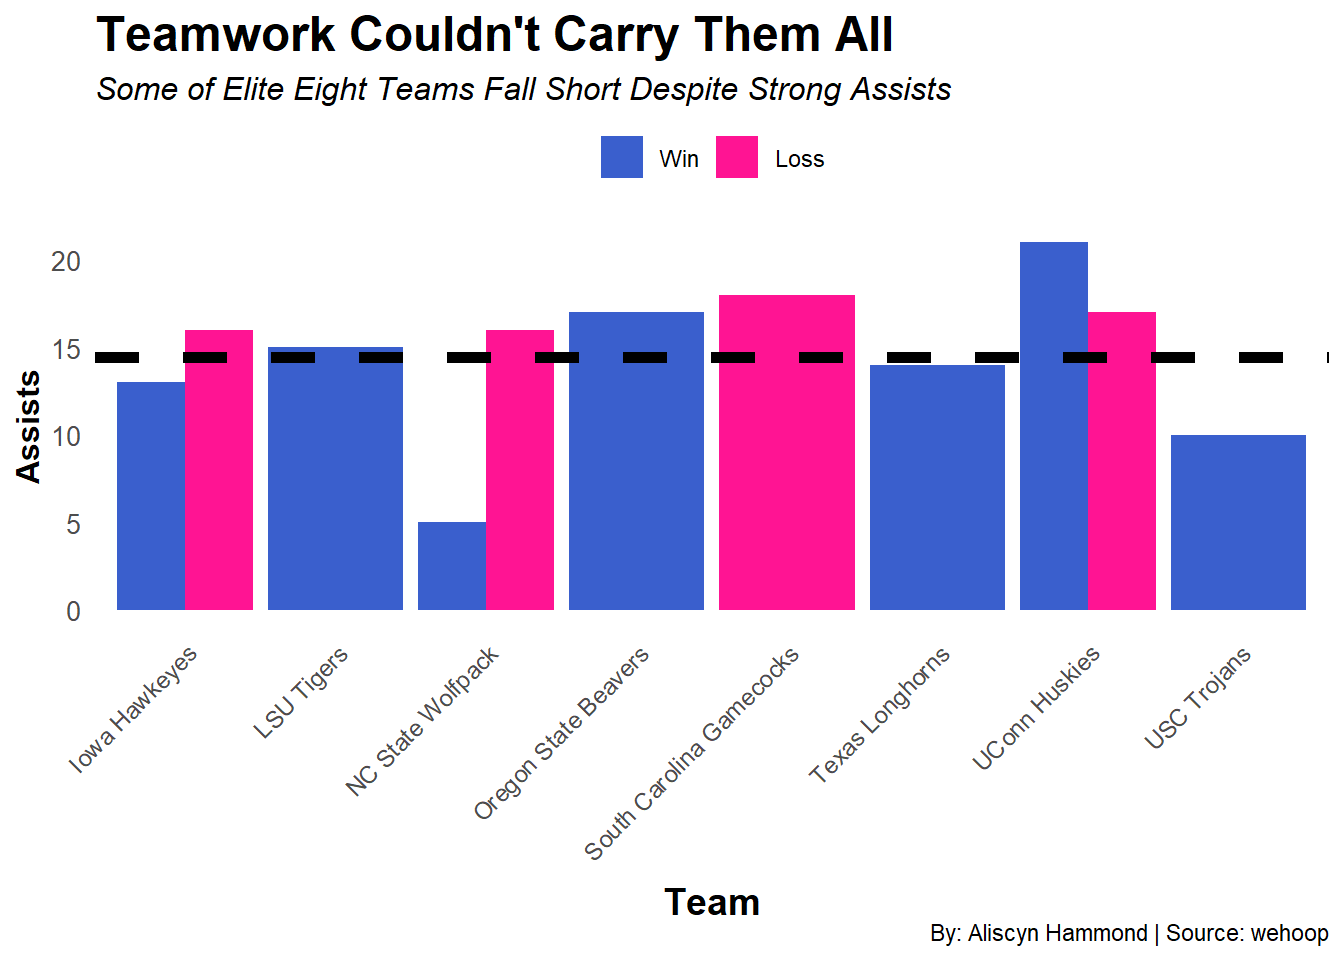
#| message: FALSE#| warning: FALSElibrary(tidyverse)library(dplyr)elite <-read.csv("dataproject/2024_elite_eight_wbb.csv")avg_assists <-mean(elite_eight$assists, na.rm =TRUE)elite_eight <- elite_eight %>%mutate(team_status =ifelse(team_winner ==TRUE, "Winning", "Losing"))ggplot(elite_eight, aes(x = team_display_name, y = assists, fill = team_status)) +geom_bar(stat ="identity", position ="dodge") +geom_hline(yintercept = avg_assists, linetype ="dashed", linewidth =2, color ="black") +labs(title ="Teamwork Couldn't Carry Them All",subtitle ="Some of Elite Eight Teams Fall Short Despite Strong Assists",x ="Team",y ="Assists",caption ="By: Aliscyn Hammond | Source: wehoop" ) +theme_minimal() +scale_fill_manual(values =c("royalblue3", "deeppink"), labels =c("Win", "Loss") ) +scale_color_manual(values =c("royalblue3", "deeppink") ) +theme(plot.title =element_text(size =18, face ="bold"),plot.subtitle =element_text(size =12, face ="italic"),axis.title =element_text(size =12, face ="bold"),axis.title.x =element_text(size =14, face ="bold", hjust =0.5, vjust =-1),axis.text.x =element_text(angle =45, hjust =1, size =9), axis.text.y =element_text(size =10),panel.grid =element_blank(),legend.title =element_blank(), legend.position ="top" )
The bar chart displays the number of assists for teams based on their performance in the games against Elite Eight opponents. Teams that won all their games in the Elite Eight are represented by one bar, while teams that lost all their games have another, For teams with a split result (one win and one loss), a noticeable trend arises: the game in which they won generally had fewer assists, with the exception of UConn, who recorded more assists in their winning game. Notably, Iowa and NC State were the only two teams that had fewer assists in their winning games compared to their losing games.
While winning teams generally had higher average assist total, there wasn’t a clear, direct correlation between assists and victory. Some teams with high assists still lost, suggesting that assists alone do not guarantee success. Assists are critical for creating scoring opportunities, but do not ensure those opportunities are converted into points. As we saw Iowa and NC State had few assists and still won which could lead to looking into other details like relying on individual performances or strong defense, which allows them to secure victories despite lower assist numbers.
Assists Distribution: A More Deeper Look into Variability
Now let’s explore the distribution of assists among winning and losing teams in greater detail. Instead of merely focusing on the averages, we can analyze the spread of assists within each team to better understand variability. Do winning teams consistently excel at ball distribution, or do their assist figures fluctuate more than anticipated? To help us understand this, we will use a boxplot, which will show us the range of assists for both winning and losing teams. Using this will highlight where most teams fall in terms of assists, as well as show any outliers—teams with unusually high or low assist numbers. The distribution of assists and whether there is a discernible difference between winning and losing teams will be more clear.
Code
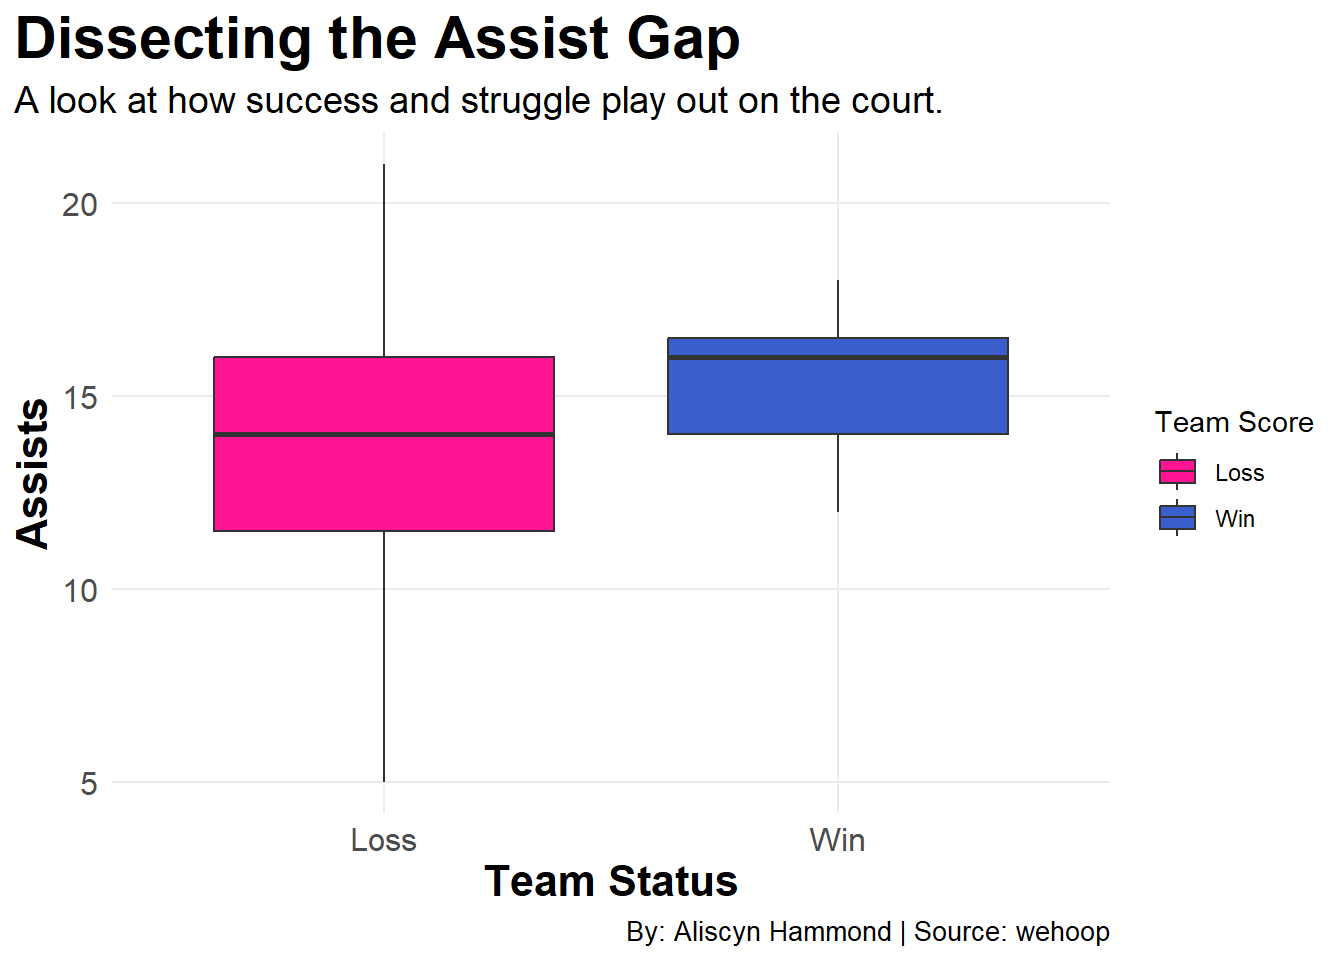
library(tidyverse)library(ggplot2)ggplot(elite_eight, aes(x =factor(team_winner, labels =c("Loss", "Win")), y = assists, fill = team_winner)) +geom_boxplot() +labs(title ="Dissecting the Assist Gap",subtitle ="A look at how success and struggle play out on the court.",x ="Team Status",y ="Assists",caption ="By: Aliscyn Hammond | Source: wehoop") +scale_fill_manual(values =c("deeppink", "royalblue3"),name="Team Score",labels=c("Loss","Win") ) +theme_minimal()+theme(plot.title =element_text(face ="bold", size =22),plot.subtitle =element_text(size =14),axis.title =element_text(size =16,face="bold"), axis.text =element_text(size =12),plot.caption=element_text(size=10,hjust=1),panel.grid.minor =element_blank(),plot.title.position ="plot")
As it shows, there are differences in distribution. Winning teams tend to have a smaller, more tightly grouped range of assists, which is positioned higher on the scale of assists compared to the losing teams. The median of the winning teams is closer to the top of the box, while the median of the losing teams is more centered, indicating that winning teams generally record higher assists. Also, the shorter “stems” for the winning teams suggest that most winning teams have a more consistent level of assists, while the longer “stems of the losing teams imply a greater spread in assist values, with some losing teams recording unusually high assists. Given this, the variability in assists among losing teams highlights that assists alone are not enough to ensure victory, suggesting that other factors more than likely influence the outcome of a game.
While assists are a vital part of basketball and correlate with team scoring, they do not guarantee victory. Some losing teams record high assists, indicating the ball movement alone is not enough to win. The variability we have seen shows that the assist distribution of both winning and losing teams suggesting that winning is determined by broader set of factors, including but not limited to, shooting accuracy, turnovers, defense, and ability to execute under pressure. The analysis of assists in the 2024 Women’s Elite Eight provides a glimpse into how team play influences game outcomes, but it also reinforces the idea that basketball is a multi-faceted sport. Success on the court depends not just on assists, but on all variety of elements working together. By exploring additional data and using statistical techniques, anyone can gain a deeper understanding of the complex nature of sport performance and truly find the true drivers of success.